I have updated the automatic lisp loader modules (LspLoad.zip on my freebies page) to support BricsCAD V17 and ZWCAD 2017. Note that the source code for LspLoad is also available.
Tag: programming
Ch-Ch-Ch-Ch-Changes
Although my blog has become relatively stagnant, the rest of my life has been changing — and there are even bigger changes ahead.
My children have been growing into adulthood one by one, and my parenting time has been shrinking as a result. To take up the slack, I bought a bike a few years ago and started riding it on the many local bike trails. Initially cycling was a way to get healthy and enjoy the outdoors, but it has turned into much more. Riding a bike is great exercise, but it’s also a fantastic social activity when you do it with friends, and I have made many new friends in the very large and growing cycling community here in Ohio.
The last few years I’ve also been racing my bike competitively in the many amateur bicycle races held during the spring and summer. I never played organized sports as a kid, so this has given me an avenue to explore an unfamiliar side of myself.
While cycling has changed my life in many ways, even bigger personal changes are on the horizon. I’ve been divorced (or as I often say, “married to my bike”) for many years, but even that will be changing later this year — unless she changes her mind before we seal the deal.
In addition to the many personal changes, I’m also making some professional changes. I’ve accepted a contract offer to join the software development team of Belgium based Bricsys, maker of BricsCAD. I will continue my philanthropic work, including work on the OpenDCL project and my participation in online ObjectARX, AutoLISP, and C++ programming forums. I will continue maintaining and supporting ManuSoft software products. I will even continue blogging here and writing for upFront.eZine, but maybe my focus will shift a bit.
I’m looking forward to all these new challenges, and excited to see where this new road leads. Thank you for travelling with me!
QuirkyPolyline updated for Bricscad and ZWCAD+
I’ve updated QuirkyPolyline and added support for Bricscad 14 – 15 and ZWCAD+ 2014 – 2015. The new QuirkyPolyline download is available on the ObjectARX freebies page.
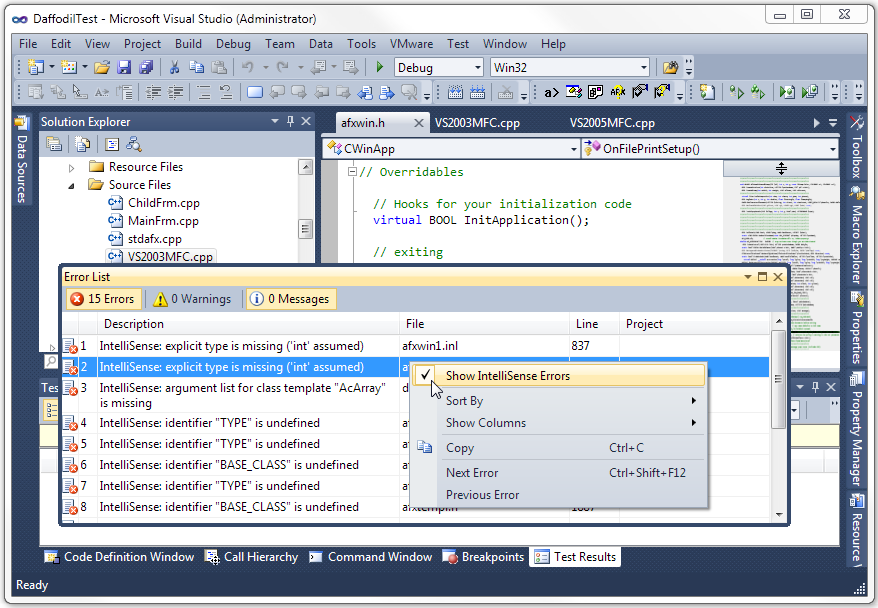
How to fix IntelliSense errors in Visual Studio
New Visual Studio C/C++ users sometimes get tripped up by IntelliSense errors, so today I’ve decided to share the secret, undocumented solution: just turn them off!
IntelliSense is a nice user interface feature when it works, but it has nothing whatever to do with building and running your C/C++ code. IntelliSense errors do not equal compiler errors, and trying to “fix” them is fruitless.
Simply right-click anywhere on the Visual Studio error list (the click must be inside the list, not outside), then uncheck “Show IntelliSense Errors”. Problem solved!
There is one small irritating issue with this solution: your setting is not persisted in the registry, so the errors have to be turned off every time you start Visual Studio.
Writing a Custom Debugger on Windows
Recently I had to debug an intermittent access violation exception in one of my AutoCAD plug-ins. I needed to get the exception while the debugger was attached so I could break the process and analyze the state of memory before AutoCAD’s global exception handler got control. Unfortunately, sometimes it took several hundred runs before the exception occurred.
To make matters worse, AutoCAD was throwing exceptions on shutdown that had nothing to do with my code. If I started AutoCAD manually under the Visual Studio debugger, I had to dismiss those shutdown exceptions manually every time. I needed a way to script the task of starting AutoCAD under the debugger hundreds of times in a row until the exception finally occurred.
After some futile attempts to script the Visual Studio debugger, I decided to just write my own custom debugger. With my own custom debugger, I could easily write code to decide at runtime which exceptions to ignore and which were of interest. The exception I was interested in always occurred while accessing a memory location that ended in 0x30, so my custom debugger ignores access violations that don’t fit the pattern.
I had also planned to see if I could suspend the main thread, detach my custom debugger, and manually attach the Visual Studio debugger when my target exception was triggered so that I could utilize the more advanced VS debugger UI. In the end I never got around to trying the debugger switch because I discovered the problem by simply displaying some relevant details in a simple message box when the target exception occurred.
As you can see, I hardcoded the application path and command line, which includes a script file that simply quit AutoCAD after it started. I then used a batch file to run the custom debugger in a loop, thereby starting and quitting AutoCAD each time through the loop. I made this debugger a console app, but it could just as well be a window app.
I don’t claim to know anything about writing debuggers; this is just something I cobbled together after doing a bit of searching on the web. I decided to share the code in case someone else runs into a similar debugging scenario.
int _tmain(int argc, _TCHAR* argv[])

{

STARTUPINFO si;

ZeroMemory( &si, sizeof(si) );

si.cb = sizeof(si);

PROCESS_INFORMATION pi;

ZeroMemory( &pi, sizeof(pi) );

static TCHAR szCmdLine[] = _T(" /nologo /b C:\Test\quit.scr");

CreateProcess ( _T("C:\Program Files\Autodesk\AutoCAD 2014\acad.exe"), szCmdLine, NULL, NULL, FALSE, DEBUG_ONLY_THIS_PROCESS, NULL,NULL, &si, &pi );


DWORD dwContinueStatus = DBG_CONTINUE;

DEBUG_EVENT debug_event = {0};

bool bFirstBreakpoint = false;

bool bContinueDebugging = true;

while( bContinueDebugging )

{

if( !WaitForDebugEvent( &debug_event, INFINITE ) )

return 0;

//process event

switch( debug_event.dwDebugEventCode )

{

case EXIT_PROCESS_DEBUG_EVENT :

{

bContinueDebugging = false;

}

break;


case EXCEPTION_DEBUG_EVENT:

{

dwContinueStatus = DBG_EXCEPTION_NOT_HANDLED;

EXCEPTION_DEBUG_INFO& exception = debug_event.u.Exception;

switch( exception.ExceptionRecord.ExceptionCode )

{

case STATUS_BREAKPOINT:

{

if( !bFirstBreakpoint )

{

bFirstBreakpoint = true;

break;

}

dwContinueStatus = DBG_EXCEPTION_HANDLED;

DebugActiveProcessStop(pi.dwProcessId);

bContinueDebugging = false;

MessageBox(NULL,_T("Debug break!"), _T("Breakpoint"), MB_OK);

}

break;


case STATUS_ACCESS_VIOLATION:

if( exception.dwFirstChance == 1 )

{

if( ((DWORD_PTR)exception.ExceptionRecord.ExceptionAddress & 0xFF) == 0x30 )

{

DebugActiveProcessStop(pi.dwProcessId);

DWORD64 Rip = (DWORD64)-1;

HANDLE hThread = OpenThread( THREAD_ALL_ACCESS, FALSE, debug_event.dwThreadId );

CONTEXT Context;

Context.ContextFlags = CONTEXT_ALL;

if( GetThreadContext(hThread, &Context) )

Rip = Context.Rip;

MEMORY_BASIC_INFORMATION mbi = { 0 };

VirtualQueryEx( pi.hProcess, exception.ExceptionRecord.ExceptionAddress, &mbi, 0x36 );

TCHAR szMsg[4096];

_stprintf_s( szMsg, _T("Access violation (%016p) at address %016prnMem State:rnBaseAddress=%016prnAllocationBase=%016prnAllocationProtect=%08xrnRegionSize=%08xrnState=%08xrnProtect=%08xrnType=%08x"), exception.ExceptionRecord.ExceptionCode, exception.ExceptionRecord.ExceptionAddress, mbi.BaseAddress, mbi.AllocationBase, mbi.AllocationProtect, mbi.RegionSize, mbi.State, mbi.Protect, mbi.Type );

MessageBox( NULL, szMsg, _T("Exception"), MB_OK );


}

bContinueDebugging = false;

}

break;


default:

break;

}

}

break;

}

ContinueDebugEvent( debug_event.dwProcessId, debug_event.dwThreadId, dwContinueStatus );

}


return 0;

}