I have updated the automatic lisp loader modules (LspLoad.zip on my freebies page) to support Bricscad V14 and ZWCAD+ 2014. Note that the source code for Lspload is also available.
Category: Technical
Programming, CAD, and other technical stuff.
LspLoad Updated for AutoCAD 2014 and Bricscad 13 64-bit
The automatic lisp loader modules (LspLoad.zip on my freebies page) have been updated to add support for AutoCAD 2014 and Bricscad 13 64-bit. The modules are now digitally signed so that AutoCAD 2014 loads them quietly.
Turning off InfoCenter in AutoCAD 2014
The AcadInfoCenterOff.msi file on the ManuSoft Freebies page has been updated to support AutoCAD 2014 based products. Note that you must log out of Autodesk 360 if you disable the InfoCenter, else some versions of AutoCAD will crash during startup.
C++ function declaration tips
Creating and calling functions is one of the most fundamental tasks in C++ programming. The function declaration serves as the primary description of a function’s interface – or contract – with callers, thereby making it the most important piece of code documentation. A good function declaration should convey as much information as possible. I’m sure an entire book could be written on the topic of function interface design, but I’ll just touch briefly on a few factors to consider when designing a function’s interface.
Error handling
Simple one-purpose functions should leave all or most error handling to the caller. This is more efficient because it eliminates error checking overhead on “known good” input values. A common pattern is a low level function that performs no input validation along with a high level function that does (and then calls the low level function to do the work). Such a design pattern gives the caller maximum flexibility.
If the function must return error (or other status) values, it should do so via the return value whenever possible, and it should define an enum or type alias (typedef) so that the return value type name makes it clear that the value is a status. Note that using the return value as a status may necessitate extra arguments passed by reference so the function has a way to return a result to the caller without using the return value.
Signed vs. unsigned
Consider this function:
int CountWords(char* pszInputString);
The int type is a signed value, but a count is always zero or greater. The return value should at least be unsigned int, or better yet size_t:
size_t CountWords(char* pszInputString);
Likewise, arguments that must never be negative should always be declared as an unsigned type.
By value or by reference
If the caller needs to pass arguments that the function will modify, they must be passed by reference. If the argument will not be modified, then it should be passed by value if it is a trivial type, else by const reference (except in unusual cases). For example:
bool CountWords(const CountOptions& options, char* pszInputString, size_t& ctWords);
Const or not
Incoming arguments that will not be modified should be declared const. This conveys a clear guarantee that the function will not try to modify the incoming value. Proper const delarations also give the optimizing compiler more ways to optimize the code.
Since counting words does not require the input string to be modifed, the CountWords() function’s string argument should really be const char* const (constant pointer to constant char) instead of char*:
size_t CountWords(const char* const pszInputString);
Now the caller can pass a string literal or any other string (even an MFC CString), and be assured that the CountWords function won’t change it.
Source code annotation language
Source code annotation language (SAL) is a fairly recent Microsoft specific development. It consists of predefined macros that help more fully express the constraints and purposes of function arguments without changing the compiled output. SAL helps convey additional information about the function’s contract with the caller, and it also helps the compiler detect potential problems at compile time by performing additional static code analysis.
As you can see below, source code annotation can get a bit messy. I rarely use source code annotation in my own code for this reason and also because it’s not portable to older versions of Visual Studio without extra work. Source code annotation is most appropriate in an API that will be consumed by others, and even then it should be considered carefully in light of its readability and portability trade-offs.
Exception specification
In C++, the exception specification conveys information about what kinds of exceptions a function may throw, either directly or indirectly via functions it calls. If a function cannot throw an exception, you should include the empty throw() suffix on the function declaration.
Putting it all together
Suppose we create a higher level function that validates the input, then calls a lower level function to count words. We might end up with something like this:
size_t CountWords(_In_z_ const char* const pszInputString) throw();
enum Status { eOK, eNull, eError, };
_Check_return_ Status ValidateAndCountWords(_In_z_ const char* const pszInputString, _Out_ size_t& ctWords) throw();
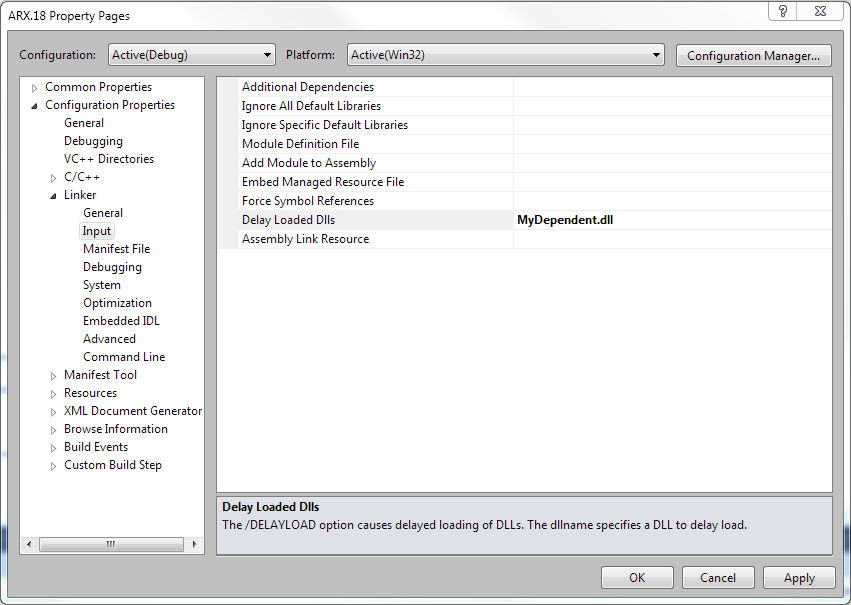
Using /delayload to specify dependent DLL path
Let’s say you have an ObjectARX module with an implicit dependency on another DLL. Your installer puts both your ARX module and the dependent DLL into a private application folder. Windows must be able to resolve the implicit DLL dependency at load time, otherwise it will fail to load your ARX module. Alas, Windows will not automatically search for the dependent DLL in your application folder, even though your ARX module is located there. Therefore your ARX module won’t load because the dependent DLL cannot be resolved.
To address this problem, you may be tempted to add your application folder to the AutoCAD support path so that Windows can find your dependent DLL. This is a Very Bad Idea – please don’t ever do it! It imposes a completely unnecessary burden on end users, and it’s not scaleable because it could cause the maximum support path length to be exceeded. A better solution is to change the implicit dependency into an explicit dependency by using the linker’s delayload feature.
Making the change is easy. First, change your ARX project’s linker settings to delayload the dependent DLL:
Next, implement a delayload hook in one of your source files to explicitly load the dependent DLL from the same folder as your ARX module:
#include <delayimp.h>
#pragma comment(lib, "delayimp")
HMODULE MyExplicitLoadLibrary( LPCSTR pszModuleName )
{
if( lstrcmpiA( pszModuleName, "MyDependent.dll" ) == 0 )
{
CHAR szPath[MAX_PATH] = "";
//_hdllInstance is the HMODULE of *this* module
DWORD cchPath = GetModuleFileNameA( _hdllInstance, szPath, MAX_PATH );
while( cchPath > 0 )
{
switch( szPath[cchPath - 1] )
{
case '\':
case '/':
case ':':
break;
default:
--cchPath;
continue;
}
break; //stop searching; found path separator
}
lstrcpynA( szPath + cchPath, pszModuleName, MAX_PATH - cchPath );
return LoadLibraryA( szPath ); //call with full path to dependent DLL
}
return NULL;
}
FARPROC WINAPI MyDliNotifyHook( unsigned dliNotify, PDelayLoadInfo pdli )
{
if( dliNotify == dliNotePreLoadLibrary )
return (FARPROC)MyExplicitLoadLibrary( pdli->szDll );
return NULL;
}
extern "C" PfnDliHook __pfnDliNotifyHook2 = MyDliNotifyHook;
When you use this technique, you do have to ensure that the delayload hook is added before any function in the dependent DLL is called. This is not a problem in most cases, but it could be a consideration if your ARX module initializes global objects whose constructors must call functions in the dependent DLL. This is just one more reason why you should avoid global variables.